Key driver analysis research is not new. The goal is to identify the different customer touchpoint experiences, which are drivers of an organization’s overall performance measure (e.g., NPS, Overall Satisfaction, Effort/Ease, etc.). Essentially, a driver analysis computes importance scores, which then prioritize the touchpoint experiences that have the greatest impact on performance measures.
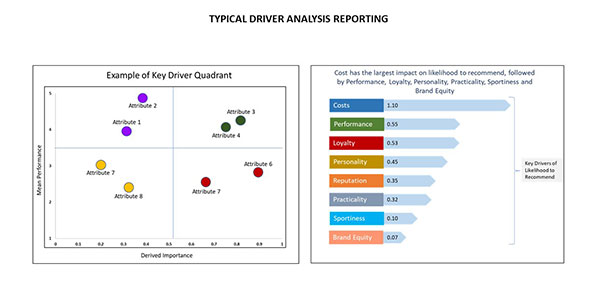
There are various multivariate approaches to determine key drivers; these methods include regression, canonical correlation, factor analysis, and correspondence analysis, among others. Regardless of the approach, driver analyses are typically reported as quadrant maps or as a data table. While somewhat easy to read, many find them perplexing to understand and interpret.
Typical driver analysis reporting approaches fail to bring the data to life, making it difficult to tell an actionable story. Historically, driver analysis only provides a basic and very limited understanding of those elements that are most important in
influencing performance measures. What they fail to provide is the insight that makes the analysis actionable and impactful.
Forgoing the actual statistics for now (that will come later), we are able to calculate the impact each key driver has on a performance measure. By providing the actual impact on performance measures, the organization can align on a common goal and give CX leaders the insights required for increased resourcing and funding.
With the prioritized drivers and their impact on performance measures, the approach then allows for the creation of a graphical roadmap that is easily interpreted and communicates the required action that must be taken by management. We call this graphical roadmap the Experience Impact
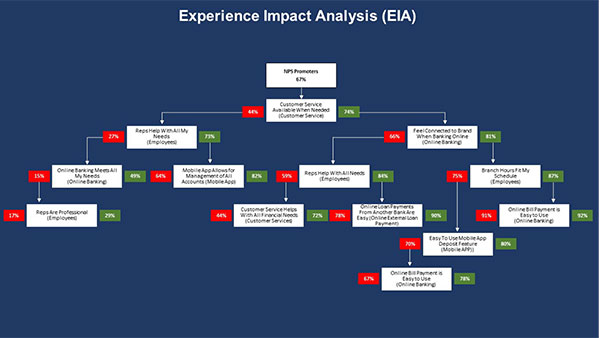
A quick interpretation of the above slide:
For the first grey box under the NPS is “Customers Service is Available When Needed,” this touchpoint experience descriptor was identified as having the single greatest impact if ALL customers believe the statement is true (rated Top 3 Box on an 11-point scale). If ALL customers believed the descriptor was true, the percentage of Promoters has the potential to increase to 74%, as indicated in the green box.
Conversely, the red box for the same descriptor indicates the potential maximum decrease if ALL customers believed the statement is not true (not rated Top 3 Box). The percent of Promoters would decrease from 67% to 44%.
Following the path to the right, you see the 4 statements that have the greatest potential to increase NPS Promoters from 67% to 92%.
By following the red box on the first descriptor, “Customers Service is Available When Needed,” you see the path to follow if you cannot deliver on “Customers Service is Available When Needed.”
Analysis. Several CX leaders have referred to it as the “CX money slide” because of its ability to align the organization and drive action.
With only a quick explanation, we often see presentation participants’ eyes widen as they understand within seconds exactly how to impact and improve the performance measure. In the example above, the purple box is the performance measure; in this case, NPS Promoters, and the percentage is 67%.
The grey boxes underneath being displayed as a hierarchical tree are the key drivers. Each driver has a green or red box associated with it. The percentages shown in the green boxes are the maximum potential increase in the performance measure if all customers believe the company delivers on the driver. The percentages in the red boxes are the maximum decrease in the performance measure if all customer believes the company does not deliver on the driver.
The Statistical Approach
Experience Impact Analysis is similar to regression analysis. However, it takes key driver studies beyond a relative importance score. It provides not only the drivers but also the numerical positive and negative impact on performance measures.
Both regression and Experience Impact Analysis are statistical methods that use data to construct models to predict the value for one variable (the performance measure in Experience Impact Analysis) based on the values reported for a set of other variables (experience variables in Experience Impact Analysis). The main differences between the Experience Impact Analysis and regression are:
- EIA reports the value of the key performance measure for each sample split to identify both the touchpoint experience causing the change as well as numerically reporting the impact of achieving a required score for that experience.
- Regression analysis provides a relationship model that indicates how each statistically identified experience measure impacts the performance measure. The approach does NOT tell you which combination of measures yields the highest performance score. This identification of the maximum possible performance measure, and which combination of experience measures are required to yield that score, is the key benefit of Experience Impact Analysis over regression.

Regression models provide the identification of statistically significant variables and a numerical score for each of those variables. The end result is to identify the variables that have the greatest impact on the performance measure, not necessarily the combination of variables that generate the HIGHEST performance measure.
EIA works differently in that an iterative approach is used to identify the combination of variables that, when considered together, generate the highest possible score for the performance measure. At the first iteration (Step 0), EIA computes either an F, T, or Chi-square value for each of the experience variables versus the performance measure.
All experience variables with a statistically significant measure of 95% or higher are selected. The one which generates the highest performance measure value is selected and becomes the first node on the tree, thus generating two branches. In iteration 2, all remaining experience variables are again considered for EACH branch. The selection process is performed by looking at the statistical significance and maximization of the performance measure. This process again generates two additional branches for each of the Iteration 2 branches. The iteration process continues until there are no longer any significant experience variables remaining, or if the sample size becomes too small for any branch to become meaningful and actionable.
The EIA approach has proven itself over the years. The technique was conceived in the early 1950s and became more mainstream in the 70s and 80s. It has been used in a variety of applications outside of marketing research. Today, it is often used as a replacement for Regression techniques and Multidimensional Scaling approaches because of its pictorial outputs and easily understood metric reporting.
In conclusion, selecting the right multivariate approach is foundational to having valid insights. The Experience Impact Analysis approach, while under-used, provides actionable insights that does not require statistical expertise to interpret and implement.
The Experience Impact Analysis answers the question, what will the empirical impact be to the performance measures.
The benefits of Experience Impact Analysis:
Visualizes the statistics
Tells a compelling story
Identify the combination of touchpoint experiences that produce the HIGHEST performance measure
Aligns organization to a common goal
Builds the business case for resourcing and funding
